Bracketology Driven by Data
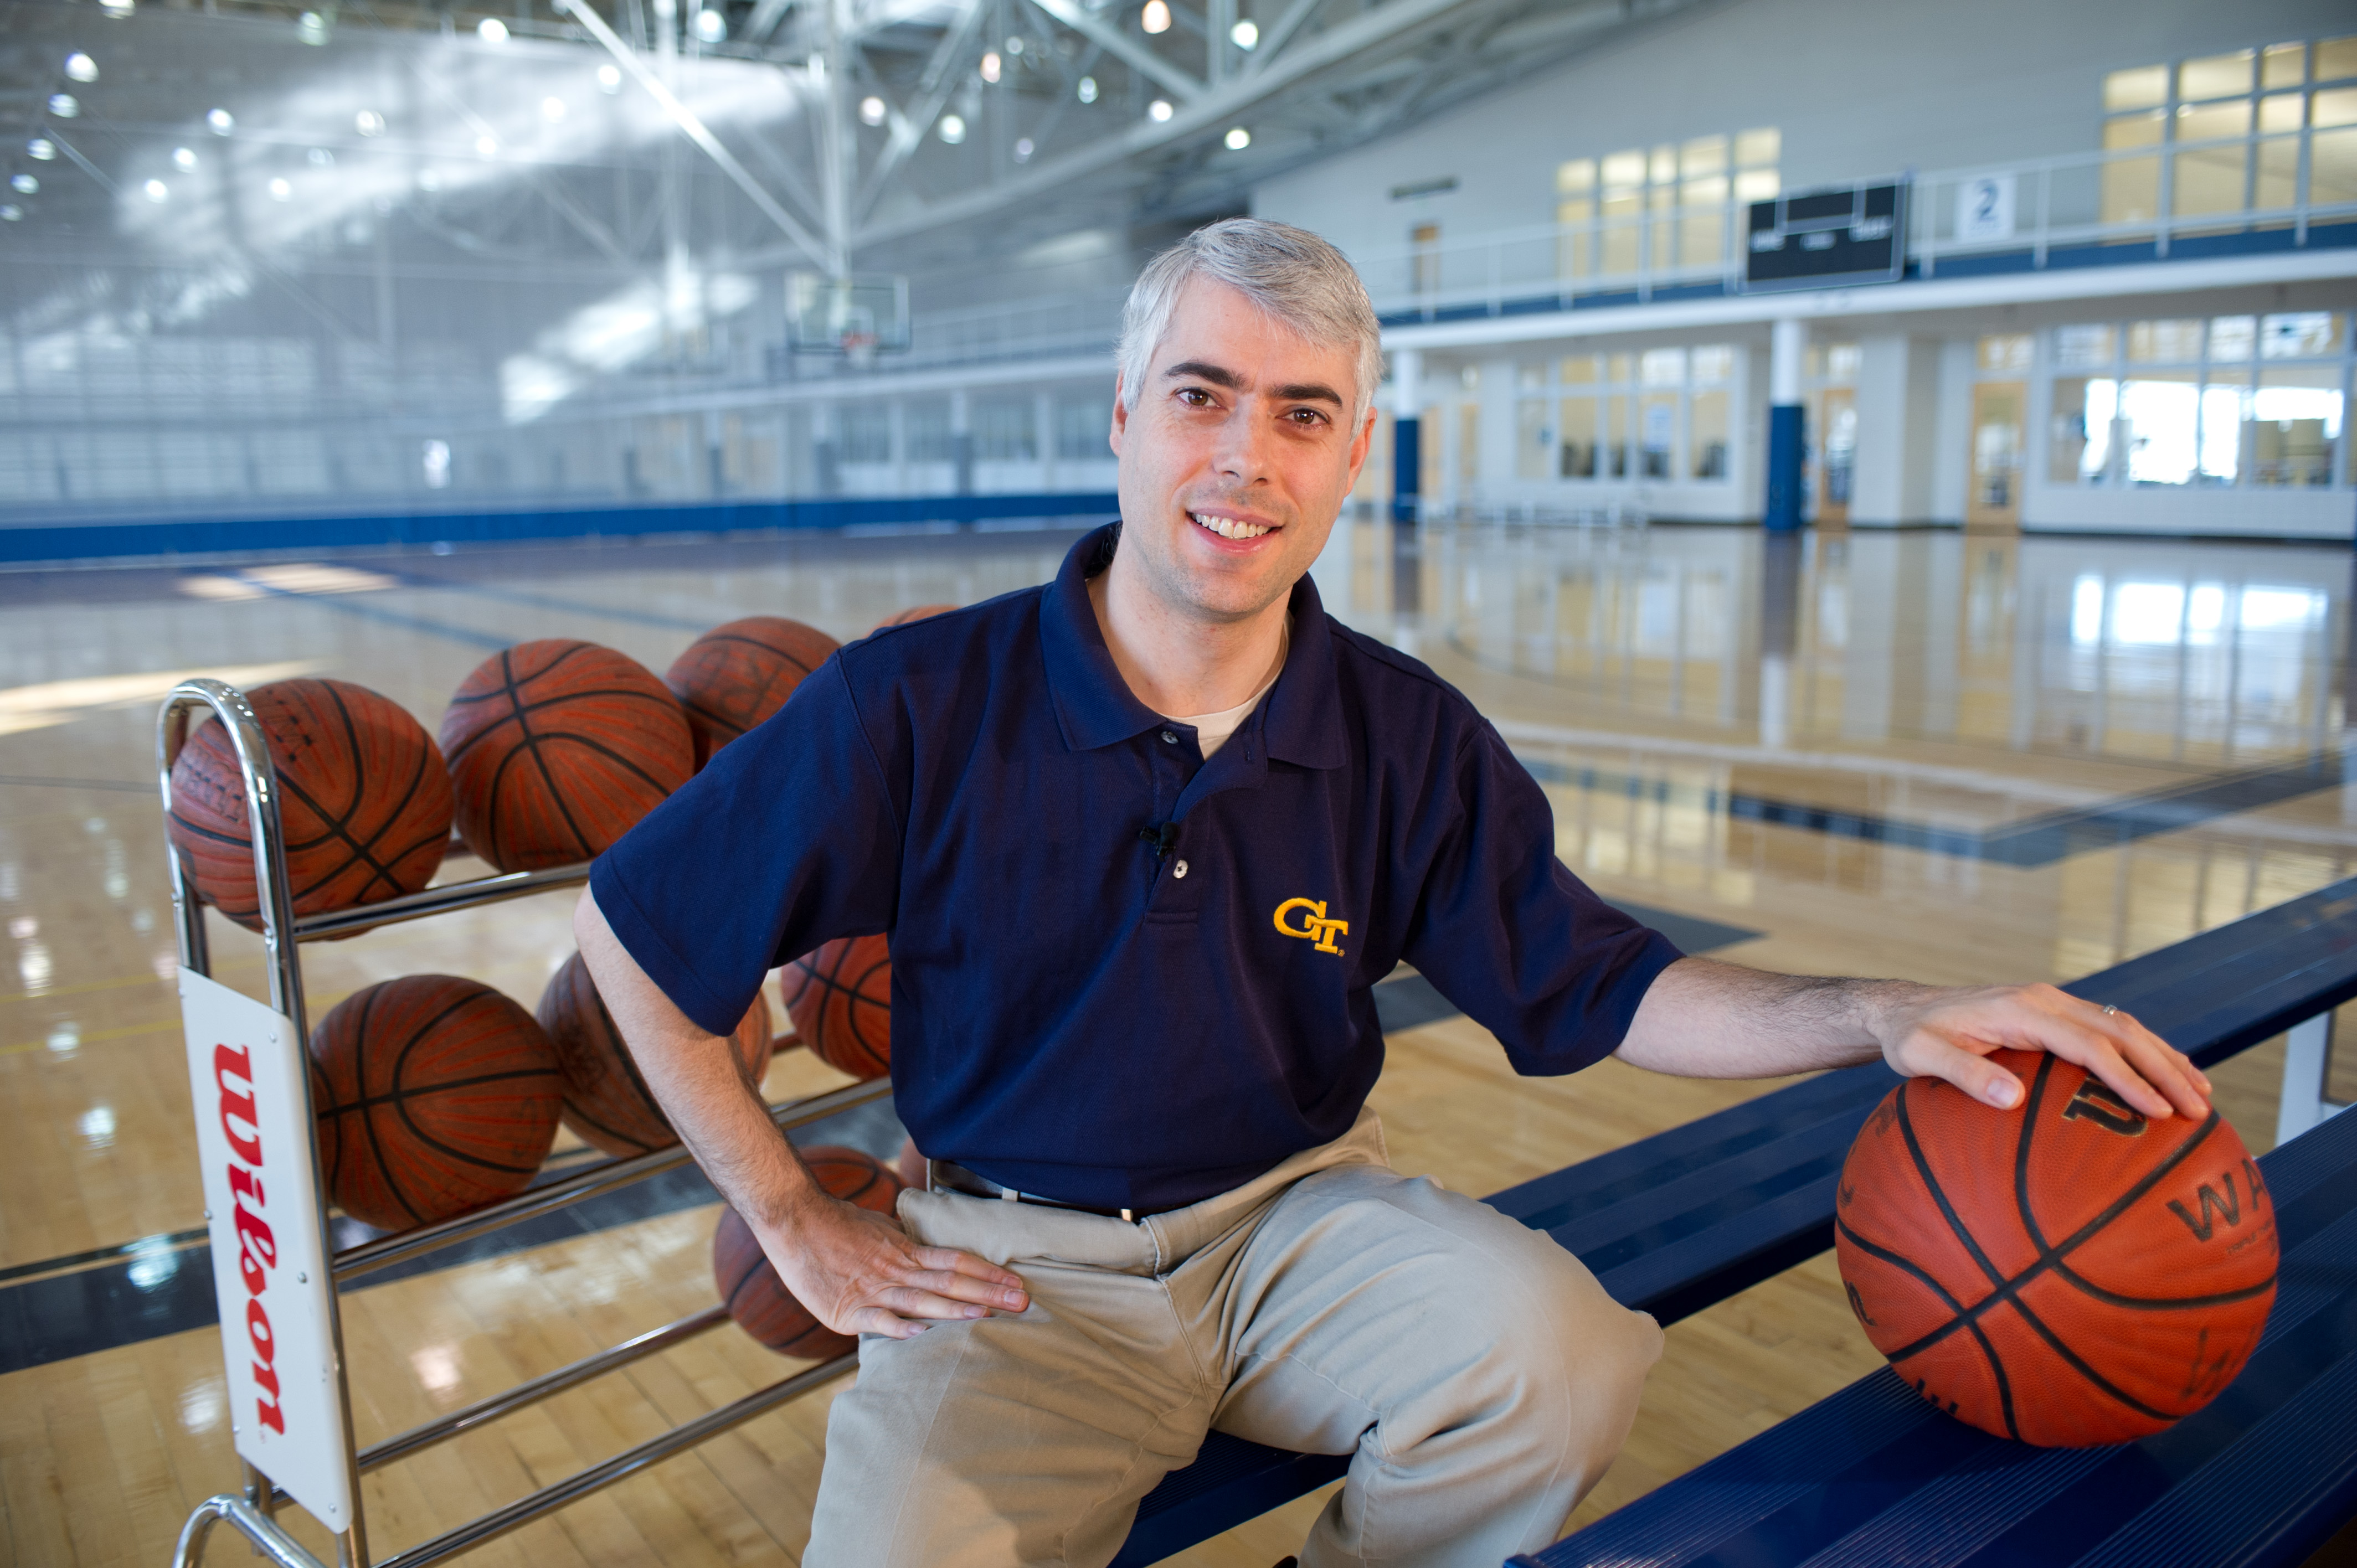
Joel Sokol, director of the Master of Science in Analytics program and the Harold E. Smalley Professor in the H. Milton Stewart School of Industrial and Systems Engineering at Georgia Tech.
Tens of millions of brackets have been filled out ahead of the NCAA men’s and women’s basketball tournaments. Some fans will choose winners based on the higher seed, others will try to predict shocking upsets, and some may choose who advances based on which mascot would win a fight, but a Georgia Tech professor has his bracket down to a (data) science.
Since 2004, Joel Sokol, director of the Master of Science in Analytics program and the Harold E. Smalley Professor in the H. Milton Stewart School of Industrial and Systems Engineering, has used a pair of analytic methods — logistic regression and Markov chains (LRMC) — to determine the best teams in college basketball. This year, Sokol’s LRMC rankings project the Michigan Wolverines to cut down the nets at the end of the men’s tournament and the Connecticut Huskies as the last team standing in the women’s field.
The algorithm compares all 350-plus Division I basketball teams against each other simultaneously during the regular season and calculates probabilities based on simple data points — who won each game, by how much, and where it was played. When the madness of March begins, Sokol’s bracket forgoes the seeds assigned to teams and fills out his bracket based on the LRMC rankings.
Models used by the tournament selection committee — NET, KPI, KenPom — measure advanced metrics like strength of schedule, possession-by-possession efficiency, opponent quality, and more, but Sokol, with expertise in sports analytics and data science, says the LRMC shows the value of simple data and a large sample size.
“The LRMC can hold its own against those models that are based on much more advanced metrics than just scoreboard data. They may look at all kinds of information, from efficiencies down to individual player performance, but the message really is that if you have a good set of simple data, that’s enough if you know how to interpret it.”
Sokol compares his algorithm to nearly 100 other ranking systems and says the LRMC is often among the top performers, with the higher-ranked teams (in the LRMC rankings) winning approximately 75% of the time — a statistic that holds true in the NCAA Tournament. Sokol says that 25% of tournament games result in an upset.
For 2026, Sokol’s projections predict that all eight No. 1 seeds — four in both the men’s and women’s tournaments — will reach the Final Four, but it’s not always a guarantee that the highest seeds make it out of their respective regions. The inaugural LRMC rankings accurately predicted the No. 3-seeded Yellow Jackets’ Final Four run in 2004 — one of the only predictive models to do so.
Sokol got the idea to compile the LRMC rankings one year before Tech’s run to the national championship game, when the Yellow Jackets were left out of the NCAA Tournament as a bubble team, largely because of a December buzzer-beater loss to Tennessee. Since the first set of rankings, machine learning and artificial intelligence have become more accessible, yet Sokol says ChatGPT and other large language models (LLMs) aren’t quite ready to handle the level of analysis required to shape the rankings.
“These LLMs are good at sounding good, but they're not so good at doing these complex quantitative tasks,” he said.
Ultimately, though, luck is often a stubbornly unquantifiable factor when filling out a bracket, no matter the formula used to make selections, and the odds of filling out a perfect bracket are all but a statistical impossibility.